Data visualization#
Python libraries for plotting:
Matplotlib
Seaborn
Why visualization is important:
Why do we “visualize” data (implying seeing it with our eyes) instead of listen to data, touch it, or taste it? It turns out our visual reasoning capacities are very strong and thus are able to detect many types of patterns easily in a picture.
Another answer to the question of “why create visualizations?” has to do with the power of visualization to clearly point out things we were not expecting via a more traditional statistical analysis.
Example: Anscomb’s Quartet ([Anscombe, 1973]) is often used to illustrate the power of visualization:
four panels each depicting a single dataset plotted as a scatterplot with a regression line
these four data sets share several numerical quantities with one another: means along either the X or Y; correlation between variable x and y; A regression line fit to each panel will result in identical coefficients.
However, clearly by looking at each panel we can see that these data are different
Exploratory Data Analysis:
summarizes the main patterns or findings related to the cognitive process of “sensemaking”
Communication
using figures to communicate the known and understood results of a dataset or experiment either in a publication, or a presentation
import pandas as pd
import seaborn as sns
import numpy as np
import os, sys
import matplotlib.pyplot as plt
%matplotlib inline
# import data downloaded from https://github.com/mvlasceanu/RegressionData/blob/da060297aea7dccb040a16be2a744b3310a3f948/data.csv
# df = pd.read_excel('data.xlsx')

# Or you can read the Excel file directly from the URL
url = 'https://github.com/mvlasceanu/RegressionData/raw/da060297aea7dccb040a16be2a744b3310a3f948/data.csv'
df = pd.read_csv(url)

df
| ResponseId | condName | BELIEFcc | POLICYcc | SHAREcc | WEPTcc | Intervention_order | Belief1 | Belief2 | Belief3 | ... | Age | Politics2_1 | Politics2_9 | Edu | Income | Indirect_SES | MacArthur_SES | PerceivedSciConsensu_1 | Intro_Timer | condition_time_total | |
|---|---|---|---|---|---|---|---|---|---|---|---|---|---|---|---|---|---|---|---|---|---|
| 0 | R_1d6rdZRmlD02sFi | FutureSelfCont | 100.00 | 100.000000 | 0.0 | 8 | PolicySocialM | 100 | 100 | 100 | ... | 40 | 100.0 | NaN | 2.0 | 1.0 | 2,3,4,6,7 | 7 | 81 | 25.566 | 1043.866 |
| 1 | R_1CjFxfgjU1coLqp | Control | 100.00 | 100.000000 | 0.0 | 1 | PolicySocialM | 100 | 100 | 100 | ... | 50 | 3.0 | 5.0 | 4.0 | NaN | 1,3,4,5,6,7 | 9 | 96 | 16.697 | 367.657 |
| 2 | R_qxty9a2HTTEq7Xb | Control | 30.25 | 66.444444 | 0.0 | 8 | PolicySocialM | 3 | 78 | 3 | ... | 36 | 48.0 | 49.0 | 3.0 | 5.0 | 2,3,4,5,6,7 | 6 | 76 | 24.055 | 79.902 |
| 3 | R_1ONRMXgQ310zjNm | BindingMoral | 4.50 | 16.000000 | 0.0 | 8 | PolicySocialM | 6 | 5 | 3 | ... | 50 | 100.0 | 100.0 | 2.0 | 6.0 | 2,3,4,5,6,7 | 6 | 22 | 11.647 | 2.701 |
| 4 | R_2VQr7rPu2yI8TnK | CollectAction | 71.75 | 67.000000 | 1.0 | 2 | PolicySocialM | 86 | 65 | 66 | ... | 34 | 81.0 | 73.0 | 4.0 | 6.0 | 1,2,3,4,5,6,7 | 10 | 76 | 26.658 | 398.695 |
| ... | ... | ... | ... | ... | ... | ... | ... | ... | ... | ... | ... | ... | ... | ... | ... | ... | ... | ... | ... | ... | ... |
| 216 | R_SCbUzWDoIpIodH3 | Control | 22.00 | 28.333333 | NaN | 8 | PolicySocialM | 17 | 31 | 16 | ... | 66 | 72.0 | 72.0 | 4.0 | 5.0 | 1,2,3,4,5,6,7 | 7 | 70 | 11.223 | 195.065 |
| 217 | R_27TYhr5VpeS4ejh | Control | 92.75 | 68.000000 | 0.0 | 8 | PolicySocialM | 94 | 87 | 100 | ... | 56 | 65.0 | 65.0 | 3.0 | 4.0 | 1,2,3,4,5,6,7 | 6 | 85 | 21.956 | 398.400 |
| 218 | R_ZC41XczQH7OQwUh | SystemJust | 98.50 | 81.333333 | 1.0 | 0 | PolicySocialM | 100 | 99 | 97 | ... | 43 | 50.0 | 52.0 | 3.0 | 8.0 | 1,2,3,4,5,6,7 | 9 | 80 | 15.358 | 124.334 |
| 219 | R_3fPjJLW85l37Mqb | PluralIgnorance | 100.00 | 80.000000 | 0.0 | 8 | PolicySocialM | 100 | 100 | 100 | ... | 71 | 40.0 | 53.0 | 4.0 | 4.0 | 1,2,3,4,5,6,7 | 6 | 100 | 15.303 | 47.831 |
| 220 | R_23UgeVaaC1npjt2 | BindingMoral | 94.25 | 66.714286 | NaN | 8 | PolicySocialM | 77 | 100 | 100 | ... | 71 | 51.0 | 53.0 | 3.0 | 4.0 | 1,2,3,5,6,7 | 5 | 20 | 7.066 | 11.945 |
221 rows × 51 columns
Histogram#
df.BELIEFcc.hist()
<Axes: >
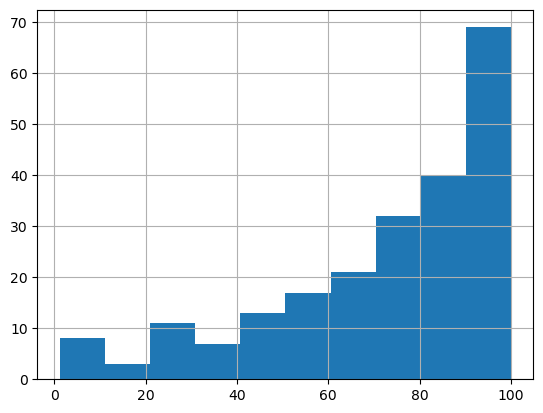
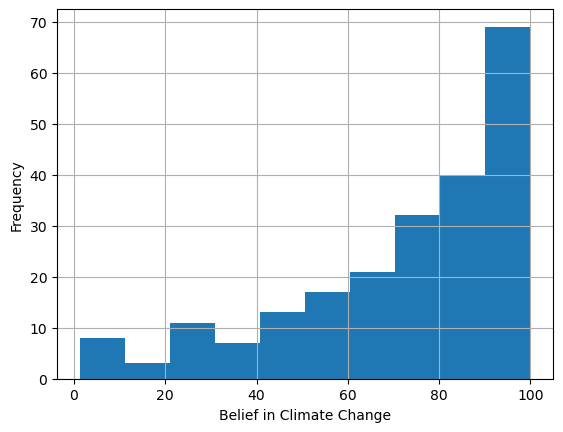
df.BELIEFcc.hist()
plt.xlabel('Belief in Climate Change')
plt.ylabel('Frequency')
Text(0, 0.5, 'Frequency')
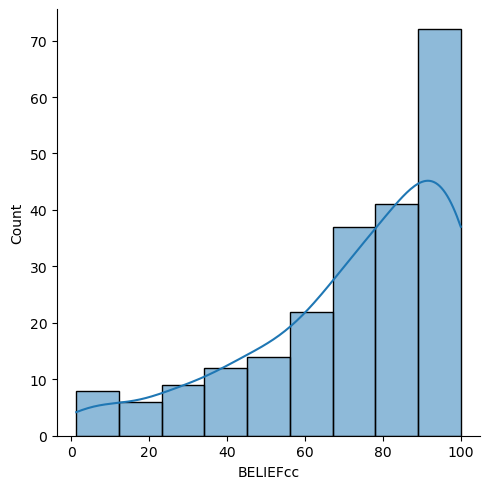
sns.displot(data=df, x='BELIEFcc', kde=True)
C:\ALL\AppData\anaconda3\envs\mada_book\Lib\site-packages\seaborn\_oldcore.py:1119: FutureWarning: use_inf_as_na option is deprecated and will be removed in a future version. Convert inf values to NaN before operating instead.
  with pd.option_context('mode.use_inf_as_na', True):
<seaborn.axisgrid.FacetGrid at 0x1cdf0cb7c90>
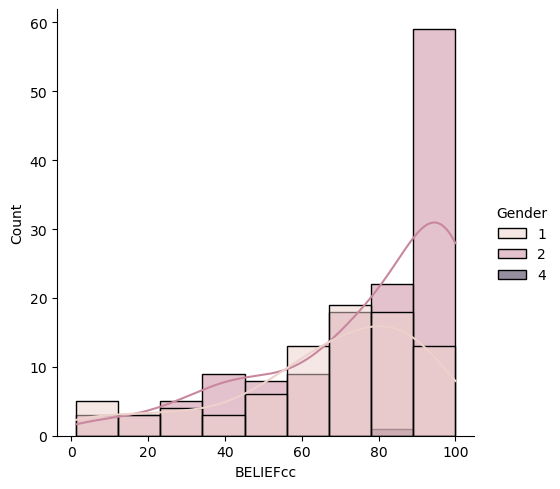
sns.displot(data=df, x='BELIEFcc', hue='Gender', kde=True)
C:\ALL\AppData\anaconda3\envs\mada_book\Lib\site-packages\seaborn\_oldcore.py:1119: FutureWarning: use_inf_as_na option is deprecated and will be removed in a future version. Convert inf values to NaN before operating instead.
  with pd.option_context('mode.use_inf_as_na', True):
<seaborn.axisgrid.FacetGrid at 0x1cdf10d3190>
Scatterplot#
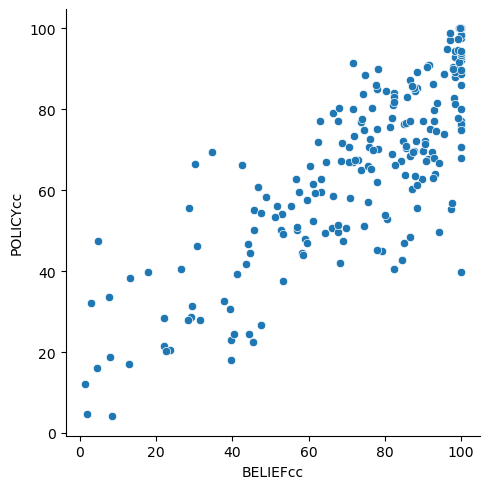
sns.relplot(x='BELIEFcc', y='POLICYcc', data=df)
<seaborn.axisgrid.FacetGrid at 0x1cdf110cb10>
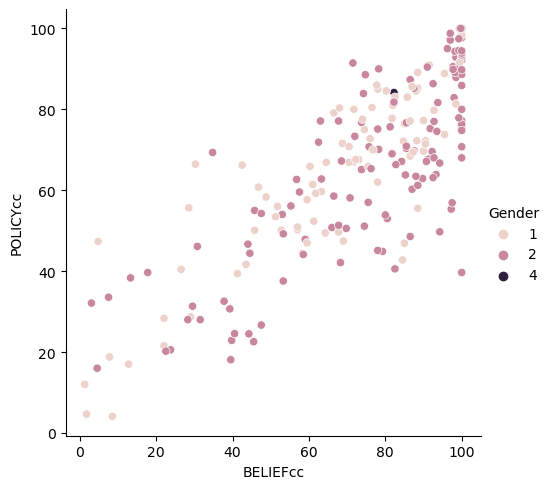
sns.relplot(x='BELIEFcc', y='POLICYcc', hue='Gender', data=df)
<seaborn.axisgrid.FacetGrid at 0x1cdf199e610>
Boxplot#
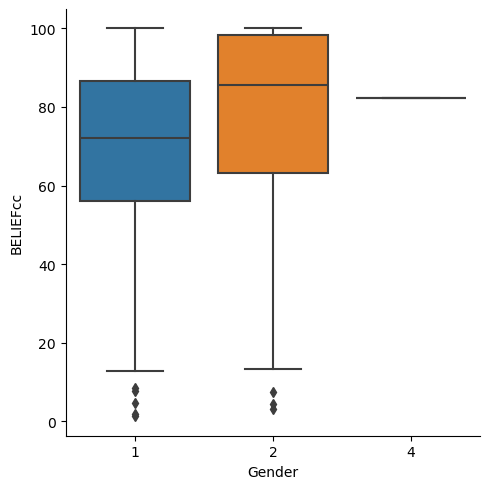
sns.catplot(x='Gender', y='BELIEFcc', kind="box", data=df)
<seaborn.axisgrid.FacetGrid at 0x1cdf5961310>
Violin plot#
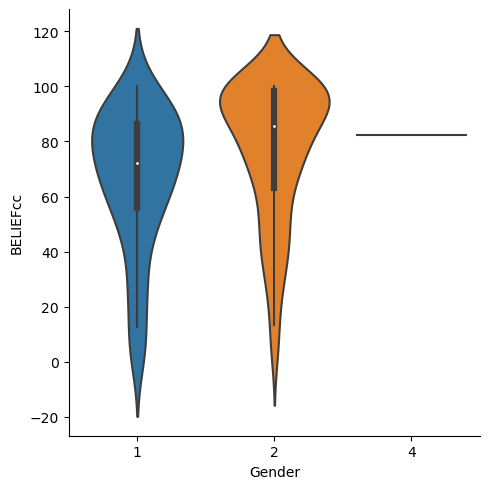
sns.catplot(x='Gender', y='BELIEFcc', kind="violin", split=True, data=df)
<seaborn.axisgrid.FacetGrid at 0x1cdf5aca1d0>
Bar plot#
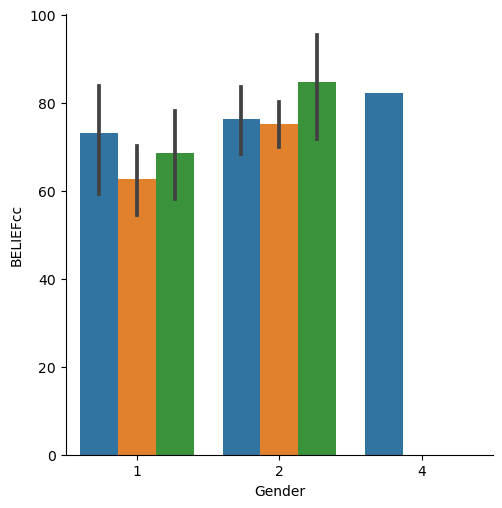
sns.catplot(x='Gender', y='BELIEFcc', kind="bar", hue='Edu', data=df)
---------------------------------------------------------------------------
AttributeError                            Traceback (most recent call last)
Cell In[11], line 1
----> 1 sns.catplot(x='Gender', y='BELIEFcc', kind="bar", hue='Edu', data=df)

File C:\ALL\AppData\anaconda3\envs\mada_book\Lib\site-packages\seaborn\categorical.py:3244, in catplot(data, x, y, hue, row, col, col_wrap, estimator, errorbar, n_boot, units, seed, order, hue_order, row_order, col_order, height, aspect, kind, native_scale, formatter, orient, color, palette, hue_norm, legend, legend_out, sharex, sharey, margin_titles, facet_kws, ci, **kwargs)
   3241 g = FacetGrid(**facet_kws)
   3243 # Draw the plot onto the facets
-> 3244 g.map_dataframe(plot_func, x=x, y=y, hue=hue, **plot_kws)
   3246 if p.orient == "h":
   3247     g.set_axis_labels(p.value_label, p.group_label)

File C:\ALL\AppData\anaconda3\envs\mada_book\Lib\site-packages\seaborn\axisgrid.py:819, in FacetGrid.map_dataframe(self, func, *args, **kwargs)
    816     kwargs["data"] = data_ijk
    818     # Draw the plot
--> 819     self._facet_plot(func, ax, args, kwargs)
    821 # For axis labels, prefer to use positional args for backcompat
    822 # but also extract the x/y kwargs and use if no corresponding arg
    823 axis_labels = [kwargs.get("x", None), kwargs.get("y", None)]

File C:\ALL\AppData\anaconda3\envs\mada_book\Lib\site-packages\seaborn\axisgrid.py:848, in FacetGrid._facet_plot(self, func, ax, plot_args, plot_kwargs)
    846     plot_args = []
    847     plot_kwargs["ax"] = ax
--> 848 func(*plot_args, **plot_kwargs)
    850 # Sort out the supporting information
    851 self._update_legend_data(ax)

File C:\ALL\AppData\anaconda3\envs\mada_book\Lib\site-packages\seaborn\categorical.py:2763, in barplot(data, x, y, hue, order, hue_order, estimator, errorbar, n_boot, units, seed, orient, color, palette, saturation, width, errcolor, errwidth, capsize, dodge, ci, ax, **kwargs)
   2760 if ax is None:
   2761     ax = plt.gca()
-> 2763 plotter.plot(ax, kwargs)
   2764 return ax

File C:\ALL\AppData\anaconda3\envs\mada_book\Lib\site-packages\seaborn\categorical.py:1587, in _BarPlotter.plot(self, ax, bar_kws)
   1585 """Make the plot."""
   1586 self.draw_bars(ax, bar_kws)
-> 1587 self.annotate_axes(ax)
   1588 if self.orient == "h":
   1589     ax.invert_yaxis()

File C:\ALL\AppData\anaconda3\envs\mada_book\Lib\site-packages\seaborn\categorical.py:767, in _CategoricalPlotter.annotate_axes(self, ax)
    764     ax.set_ylim(-.5, len(self.plot_data) - .5, auto=None)
    766 if self.hue_names is not None:
--> 767     ax.legend(loc="best", title=self.hue_title)

File C:\ALL\AppData\anaconda3\envs\mada_book\Lib\site-packages\matplotlib\axes\_axes.py:322, in Axes.legend(self, *args, **kwargs)
    204 @_docstring.dedent_interpd
    205 def legend(self, *args, **kwargs):
    206     """
    207     Place a legend on the Axes.
    208
   (...)
    320     .. plot:: gallery/text_labels_and_annotations/legend.py
    321     """
--> 322     handles, labels, kwargs = mlegend._parse_legend_args([self], *args, **kwargs)
    323     self.legend_ = mlegend.Legend(self, handles, labels, **kwargs)
    324     self.legend_._remove_method = self._remove_legend

File C:\ALL\AppData\anaconda3\envs\mada_book\Lib\site-packages\matplotlib\legend.py:1361, in _parse_legend_args(axs, handles, labels, *args, **kwargs)
   1357     handles = [handle for handle, label
   1358                in zip(_get_legend_handles(axs, handlers), labels)]
   1360 elif len(args) == 0:  # 0 args: automatically detect labels and handles.
-> 1361     handles, labels = _get_legend_handles_labels(axs, handlers)
   1362     if not handles:
   1363         log.warning(
   1364             "No artists with labels found to put in legend.  Note that "
   1365             "artists whose label start with an underscore are ignored "
   1366             "when legend() is called with no argument.")

File C:\ALL\AppData\anaconda3\envs\mada_book\Lib\site-packages\matplotlib\legend.py:1291, in _get_legend_handles_labels(axs, legend_handler_map)
   1289 for handle in _get_legend_handles(axs, legend_handler_map):
   1290     label = handle.get_label()
-> 1291     if label and not label.startswith('_'):
   1292         handles.append(handle)
   1293         labels.append(label)

AttributeError: 'numpy.float64' object has no attribute 'startswith'
# Adding plot features (colors, labels, limits) and saving the figure. Choose color codes from this website: https://coolors.co/

colors = ['#FE5F55', '#388697', '#71697A']

fig, ax = plt.subplots(1,1, figsize=(4,4.5))

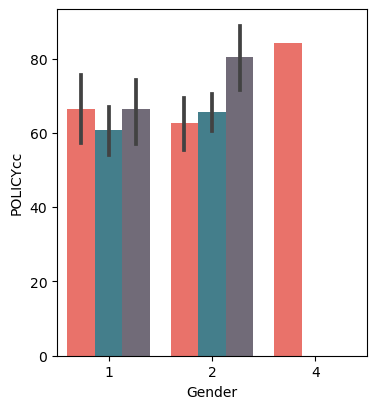
sns.barplot(x='Gender', y='POLICYcc', hue='Edu', data=df, palette=colors, ax=ax)

ax.set_ylabel('Support for policy')
ax.set_xlabel('Gender')
ax.set_xticklabels(['Man', 'Woman', 'Other'])
ax.set_ylim(50,90)
ax.legend(ax.patches[::3], ['low', 'mod', 'high'])

plt.tight_layout()
plt.savefig('figure1.png', dpi=300, format='png')
---------------------------------------------------------------------------
AttributeError                            Traceback (most recent call last)
Cell In[12], line 7
      3 colors = ['#FE5F55', '#388697', '#71697A']
      5 fig, ax = plt.subplots(1,1, figsize=(4,4.5))
----> 7 sns.barplot(x='Gender', y='POLICYcc', hue='Edu', data=df, palette=colors, ax=ax)
      9 ax.set_ylabel('Support for policy')
     10 ax.set_xlabel('Gender')

File C:\ALL\AppData\anaconda3\envs\mada_book\Lib\site-packages\seaborn\categorical.py:2763, in barplot(data, x, y, hue, order, hue_order, estimator, errorbar, n_boot, units, seed, orient, color, palette, saturation, width, errcolor, errwidth, capsize, dodge, ci, ax, **kwargs)
   2760 if ax is None:
   2761     ax = plt.gca()
-> 2763 plotter.plot(ax, kwargs)
   2764 return ax

File C:\ALL\AppData\anaconda3\envs\mada_book\Lib\site-packages\seaborn\categorical.py:1587, in _BarPlotter.plot(self, ax, bar_kws)
   1585 """Make the plot."""
   1586 self.draw_bars(ax, bar_kws)
-> 1587 self.annotate_axes(ax)
   1588 if self.orient == "h":
   1589     ax.invert_yaxis()

File C:\ALL\AppData\anaconda3\envs\mada_book\Lib\site-packages\seaborn\categorical.py:767, in _CategoricalPlotter.annotate_axes(self, ax)
    764     ax.set_ylim(-.5, len(self.plot_data) - .5, auto=None)
    766 if self.hue_names is not None:
--> 767     ax.legend(loc="best", title=self.hue_title)

File C:\ALL\AppData\anaconda3\envs\mada_book\Lib\site-packages\matplotlib\axes\_axes.py:322, in Axes.legend(self, *args, **kwargs)
    204 @_docstring.dedent_interpd
    205 def legend(self, *args, **kwargs):
    206     """
    207     Place a legend on the Axes.
    208
   (...)
    320     .. plot:: gallery/text_labels_and_annotations/legend.py
    321     """
--> 322     handles, labels, kwargs = mlegend._parse_legend_args([self], *args, **kwargs)
    323     self.legend_ = mlegend.Legend(self, handles, labels, **kwargs)
    324     self.legend_._remove_method = self._remove_legend

File C:\ALL\AppData\anaconda3\envs\mada_book\Lib\site-packages\matplotlib\legend.py:1361, in _parse_legend_args(axs, handles, labels, *args, **kwargs)
   1357     handles = [handle for handle, label
   1358                in zip(_get_legend_handles(axs, handlers), labels)]
   1360 elif len(args) == 0:  # 0 args: automatically detect labels and handles.
-> 1361     handles, labels = _get_legend_handles_labels(axs, handlers)
   1362     if not handles:
   1363         log.warning(
   1364             "No artists with labels found to put in legend.  Note that "
   1365             "artists whose label start with an underscore are ignored "
   1366             "when legend() is called with no argument.")

File C:\ALL\AppData\anaconda3\envs\mada_book\Lib\site-packages\matplotlib\legend.py:1291, in _get_legend_handles_labels(axs, legend_handler_map)
   1289 for handle in _get_legend_handles(axs, legend_handler_map):
   1290     label = handle.get_label()
-> 1291     if label and not label.startswith('_'):
   1292         handles.append(handle)
   1293         labels.append(label)

AttributeError: 'numpy.float64' object has no attribute 'startswith'
Point plot#
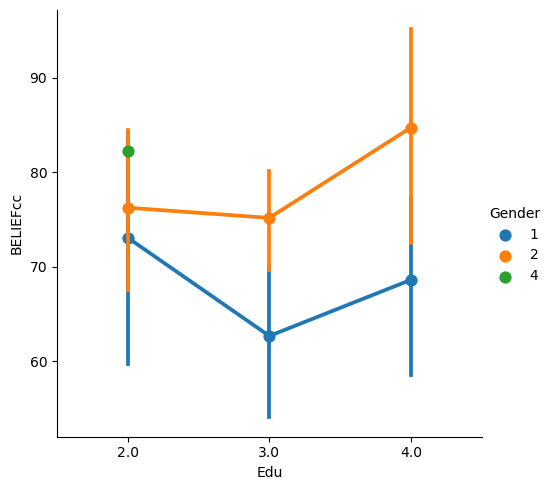
sns.catplot(x='Edu', y='BELIEFcc', kind="point", hue='Gender', data=df)
<seaborn.axisgrid.FacetGrid at 0x1ec85ffaf10>
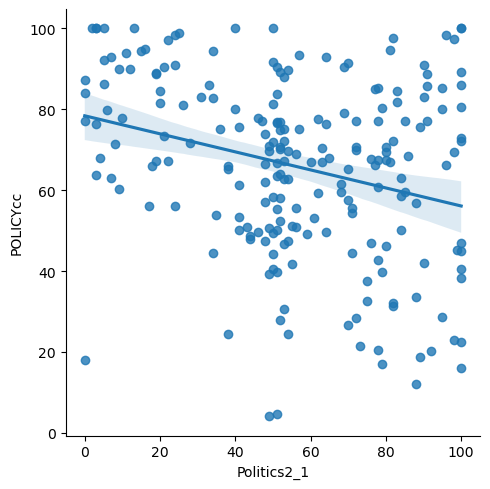
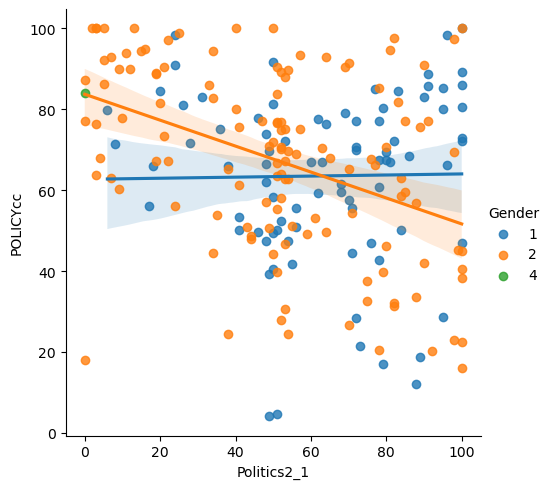
Linear regression plot#
sns.lmplot(x='Politics2_1', y='POLICYcc', data=df)
<seaborn.axisgrid.FacetGrid at 0x1ec85f028d0>
sns.lmplot(x='Politics2_1', y='POLICYcc', hue='Gender', data=df)
<seaborn.axisgrid.FacetGrid at 0x1ecffbf2350>
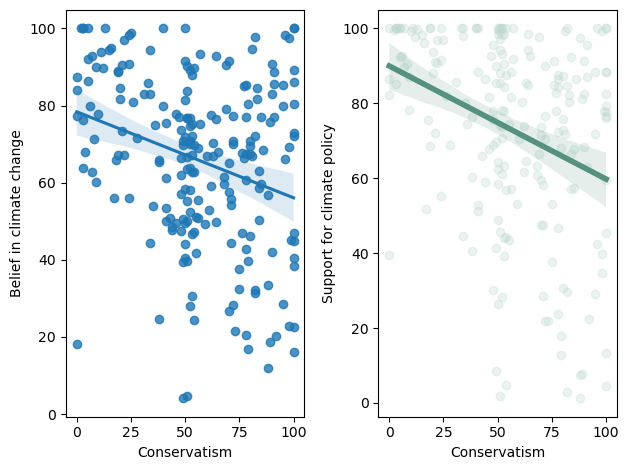
# Adding plot features (colors, labels, limits) and saving the figure. Choose color codes from this website: https://coolors.co/

colors = ['#FE5F55', '#388697', '#71697A']

fig, ax = plt.subplots(1,2)

sns.regplot(x='Politics2_1', y='POLICYcc', data=df, ax=ax[0])

sns.regplot(x='Politics2_1', y='BELIEFcc', data=df, ax=ax[1], \
            scatter_kws={"color": "#BFD9D0","alpha":.3}, \
            line_kws={"color":"#55917F","alpha":1,"lw":4})


ax[0].set_xlabel('Conservatism')
ax[1].set_xlabel('Conservatism')

ax[0].set_ylabel('Belief in climate change')
ax[1].set_ylabel('Support for climate policy')


plt.tight_layout()
plt.savefig('figure2.png', dpi=300, format='png')
Additional plots and documentation: https://seaborn.pydata.org/index.html
